

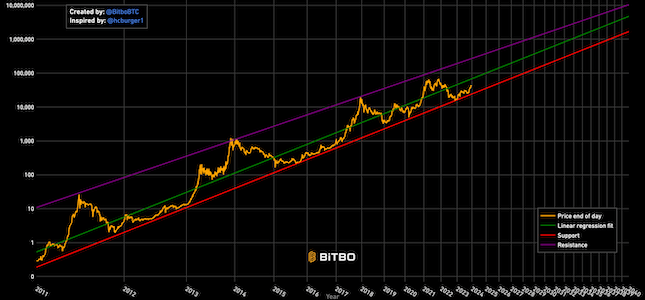
Long Term Power Law
Bitcoin’s natural long-term power-law corridor of growth.
Data & charts updated every 5 minutes
Chart |
The Halving Price Regression (HPR) is a non-linear regressions curve calculated using only the bitcoin prices on the 3 halving dates. This method excludes the hype cycles to create a conservative trend line. The blue band is on trend (+/- 6 month) with each band above being another year ahead of the trend line. Green = 1 year ahead of trend, Yellow = 2 years ahead, etc. Logarithmic (non linear) Regression log10(price) = 2.6521LN(x)-18.163 Inputs: 28-Nov-2012 $12.33, 9-Jul-2016 $651.94, 11-May-2020 $8,591.65
Bitcoin’s natural long-term power-law corridor of growth.
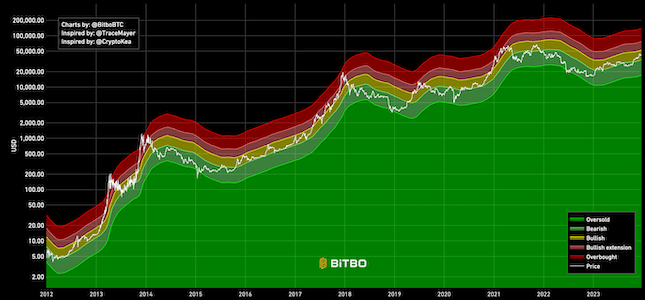
The Mayer Multiple Price Bands chart is a simple modification to the original Mayer Multiple.
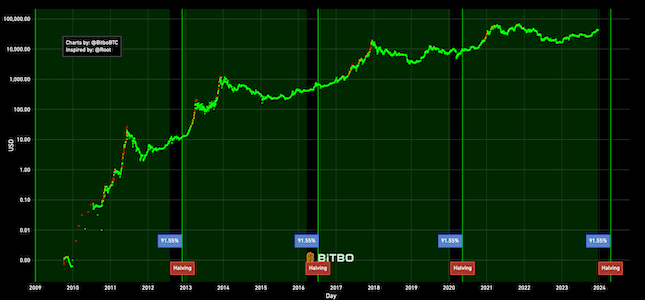
Shows Bitcoin's price in its current cycle compared to past cycles. Red dots indicate all-time highs.